Tehran vs. Qujing: Detailed 2026 Cost of Living & Quality Comparison
 Tehran
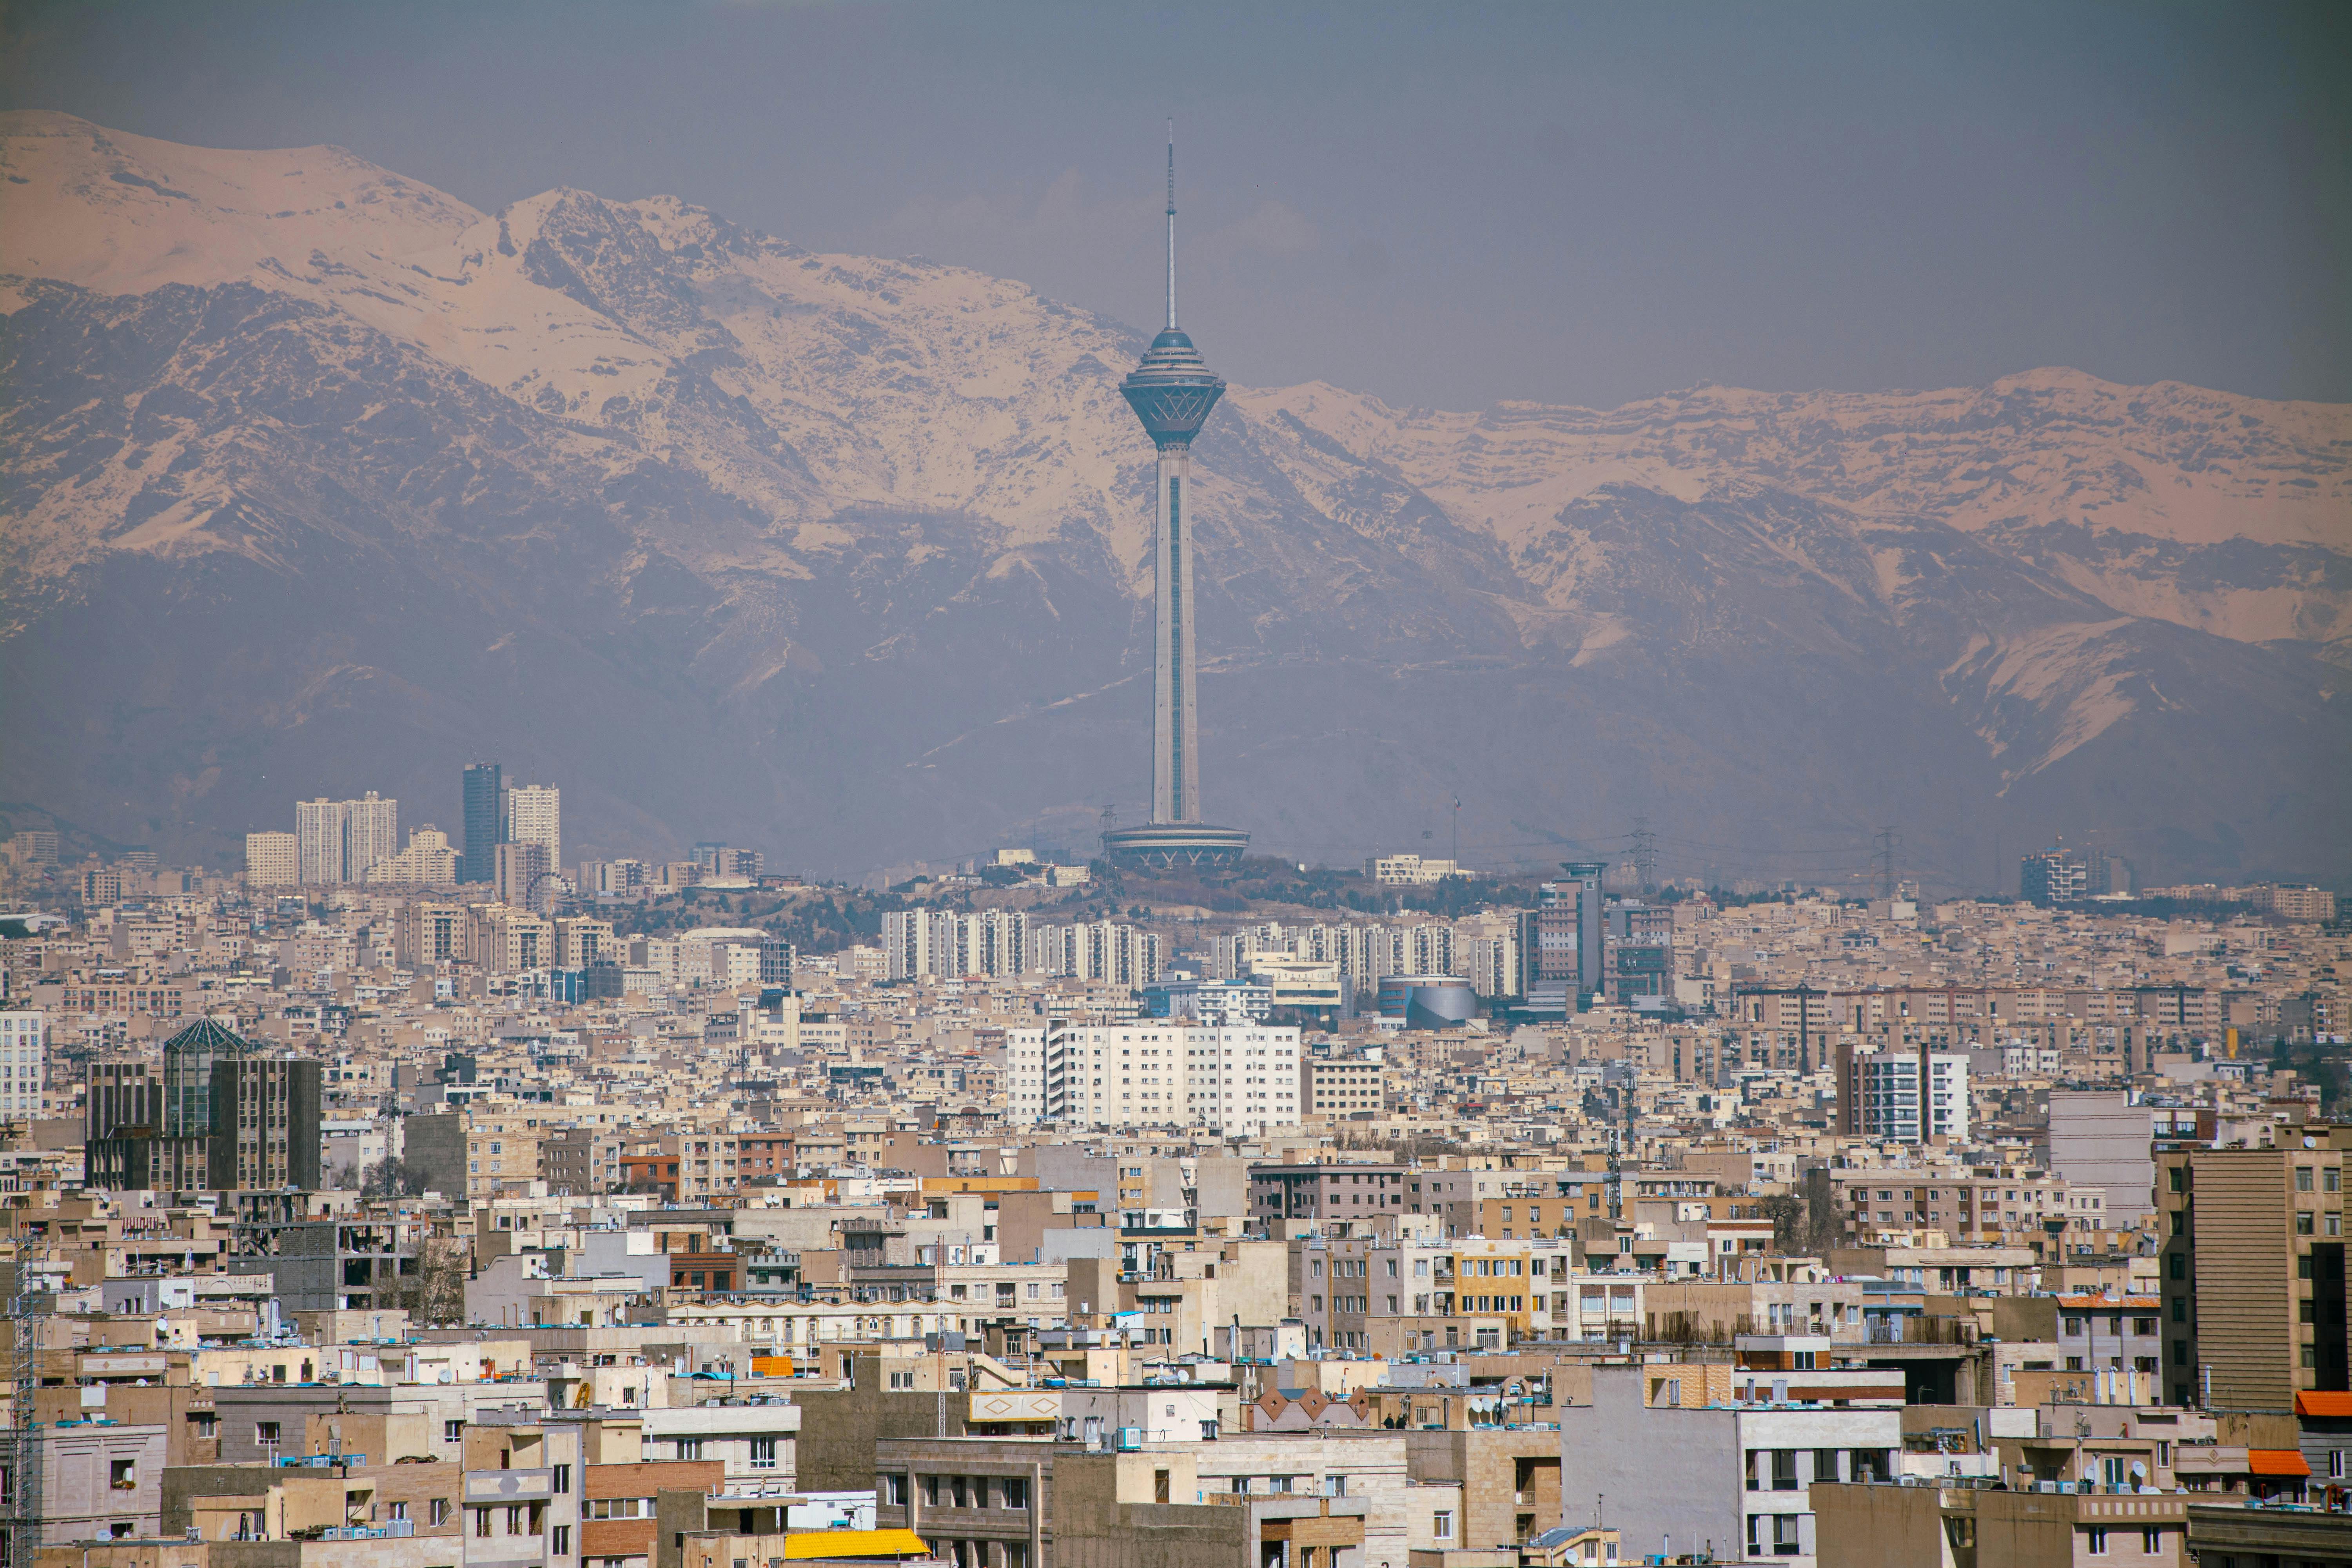
Image by:Mehdi Salehi
Tehran
Image by:Mehdi Salehi
Overview
Tehran, the capital of Iran, is a sprawling metropolis with a population exceeding 14 million, representing one of the largest urban centers in the Middle East. It faces significant challenges related to its sheer size, including high population density, substantial traffic congestion, and notable environmental pollution issues. In contrast, Qujing is a major city in China's Yunnan province, with a population of approximately 5.77 million. While also large, Qujing's economic profile and cost structure differ significantly from Tehran's. Tehran's economy is heavily influenced by government and state-owned enterprises, alongside some private sector activity, though it grapples with international economic sanctions and domestic economic pressures. Qujing, benefiting from China's robust and integrated economy, exhibits a more dynamic economic landscape, characterized by lower costs of living and higher average salaries compared to Tehran, reflecting China's overall economic strength and development level.Economic/Housing Comparison
Economically, Tehran presents a challenging picture for international comparison due to its complex economic environment and the impact of international sanctions, which likely constrain its economic growth and investment potential. The average monthly net salary in Tehran is significantly lower than in Qujing, at $211.63 versus $943.07. This stark difference is mirrored in the GDP per capita figures, with Tehran at $15,900 compared to Qujing's $22,100. Furthermore, Tehran's high cost of living, particularly for housing, combined with its relatively low salaries, creates a very high property price-to-income ratio of 27.61, indicating that housing costs are a major burden for residents. Qujing, on the other hand, offers a much more favorable economic environment. With a significantly higher average net salary ($943.07) and a lower cost of living index (144.69 compared to Tehran's 22.81), Qujing presents a much better financial proposition. Housing affordability in Qujing is substantially improved, reflected in lower property prices relative to salaries, making homeownership more accessible despite the city's size.Quality of Life Comparison
Assessing the quality of life between Tehran and Qujing reveals significant disparities across various indices. Tehran scores considerably lower on several key quality metrics. Its safety index is low at 42.77, reflecting potential security concerns common in large, complex urban environments. The healthcare index (53.28) and pollution index (80.35) are also notably lower than Qujing's indicators, although specific data for Qujing is limited to regional comparisons (Kunming/Yunnan). Qujing, particularly when compared to Tehran, appears to offer a superior quality of life in terms of safety, healthcare access, and environmental conditions. The city benefits from China's national healthcare system and generally cleaner urban environments compared to many Middle Eastern capitals. While Tehran has higher quality-of-life scores in certain areas like healthcare and safety relative to its own historical context or other Iranian cities, the overall comparison, especially considering pollution and safety, strongly favors Qujing.Investment and Growth Comparison
For potential investors or businesses, the investment climate favors Qujing significantly. China's consistent economic growth, reflected in Qujing's GDP growth rate of 5.25%, provides a stable and expanding market. The low annual mortgage interest rate of 3.0% further enhances investment affordability. Qujing's population growth rate, though lower than Tehran's (0.23% vs 0.88%), still indicates a stable urban center. Tehran's investment climate is complicated by economic sanctions, higher inflation risks, and potentially less predictable regulatory environments, making it a riskier proposition for international investment compared to the more stable and transparent Chinese market represented by Qujing. The disparity in property prices between the two cities is also evident, with Qujing's property prices being significantly lower than Tehran's, even when adjusted for the higher salaries in Qujing.Final Verdict
In conclusion, while Tehran represents a major global city with its own unique cultural and geopolitical significance, it presents a challenging environment for quality of life and economic opportunity, characterized by high costs, significant pollution, and complex economic realities. Qujing, as a large city within China's thriving economy, offers a vastly superior combination of economic opportunity, lower costs of living, and better quality-of-life indicators, particularly regarding safety, healthcare, and environmental conditions. For individuals or businesses seeking a more stable economic environment, lower financial burdens, and a higher quality of life, Qujing presents a significantly more attractive proposition than Tehran, despite both being substantial urban centers.Real estate & living comparison
| Tehran | Qujing | |
|---|---|---|
| Salaries And Financing » Annual Mortgage Interest Rate (20-Year Fixed, in %) | 24.5 USD | 3 USD |
| Salaries And Financing » Average Monthly Net Salary (After Tax) | 211.63 USD | 943.07 USD |
| Salaries And Financing » GDP Growth Rate: | 5.04 USD | 5.25 USD |
| Salaries And Financing » GDP Per Capita ($) : | 15900 USD | 22100 USD |
| Salaries And Financing » Population Growth Rate: | 0.88 USD | 0.23 USD |
| Clothing And Shoes » Jeans (Levi's 501 or Similar) | 25.51 USD | 58.03 USD |
| Clothing And Shoes » Men's Leather Business Shoes | 68.12 USD | 58.03 USD |
| Clothing And Shoes » Nike Running Shoes (Mid-Range) | 105.78 USD | 58.03 USD |
| Clothing And Shoes » Summer Dress in a Chain Store (e.g. Zara or H&M) | 33.16 USD | 43.53 USD |
| Markets » Apples (1 kg) | 1.16 USD | 1.45 USD |
| Markets » Bananas (1 kg) | 1.71 USD | 1.02 USD |
| Markets » Beef Round or Equivalent Back Leg Red Meat (1 kg) | 9.98 USD | 11.61 USD |
| Markets » Bottled Water (1.5 Liter) | 0.27 USD | 0.73 USD |
| Markets » Chicken Fillets (1 kg) | 2.98 USD | 3.63 USD |
| Markets » Cigarettes (Pack of 20, Marlboro) | 2.5 USD | 3.63 USD |
| Markets » Eggs (12, Large Size) | 1.12 USD | 1.74 USD |
| Markets » Fresh White Bread (500 g Loaf) | 0.55 USD | 1.31 USD |
| Markets » Milk (Regular, 1 Liter) | 0.62 USD | 1.45 USD |
| Markets » Oranges (1 kg) | 1.06 USD | 1.45 USD |
| Markets » Potatoes (1 kg) | 0.56 USD | 0.29 USD |
| Markets » White Rice (1 kg) | 2.97 USD | 0.73 USD |
| Restaurants » Bottled Water (0.33 Liter) | 1.59 USD | 0.29 USD |
| Restaurants » Cappuccino (Regular Size) | 1.18 USD | 2.18 USD |
| Restaurants » Combo Meal at McDonald's (or Equivalent Fast-Food Meal) | 4 USD | 4.35 USD |
| Restaurants » Meal at an Inexpensive Restaurant | 3.26 USD | 1.74 USD |
| Restaurants » Meal for Two at a Mid-Range Restaurant (Three Courses, Without Drinks) | 17.5 USD | 14.51 USD |
| Restaurants » Soft Drink (Coca-Cola or Pepsi, 0.33 Liter Bottle) | 0.48 USD | 0.44 USD |
| Salaries And Financing » Annual Mortgage Interest Rate (20-Year Fixed, in %) | 24.5 USD | 3 USD |
| Salaries And Financing » Average Monthly Net Salary (After Tax) | 211.63 USD | 943.07 USD |
| Sports And Leisure » Cinema Ticket (International Release) | 1.5 USD | 5.08 USD |
| Sports And Leisure » Monthly Fitness Club Membership | 20.43 USD | 14.51 USD |
| Transportation » Gasoline (1 Liter) | 0.26 USD | 1.16 USD |
| Transportation » Monthly Public Transport Pass (Regular Price) | 5 USD | 36.27 USD |
| Transportation » One-Way Ticket (Local Transport) | 0.15 USD | 0.29 USD |
| Transportation » Taxi Start (Standard Tariff) | 0.45 USD | 1.16 USD |
| Transportation » Toyota Corolla Sedan 1.6 (or Equivalent New Mid-Size Car) | 45931.82 USD | 16685.04 USD |
| Utilities (Monthly) » Broadband Internet (Unlimited Data, 60 Mbps or Higher) | 5.32 USD | 4.35 USD |
| Utilities (Monthly) » Mobile Phone Plan (Monthly, with Calls and 10GB+ Data) | 1.69 USD | 7.25 USD |
| Population | 14,148,000 | 5,765,775 |
Last updated: 2026-03-08
Comments for this comparison