New York vs. Hengyang: Detailed 2026 Cost of Living & Quality Comparison
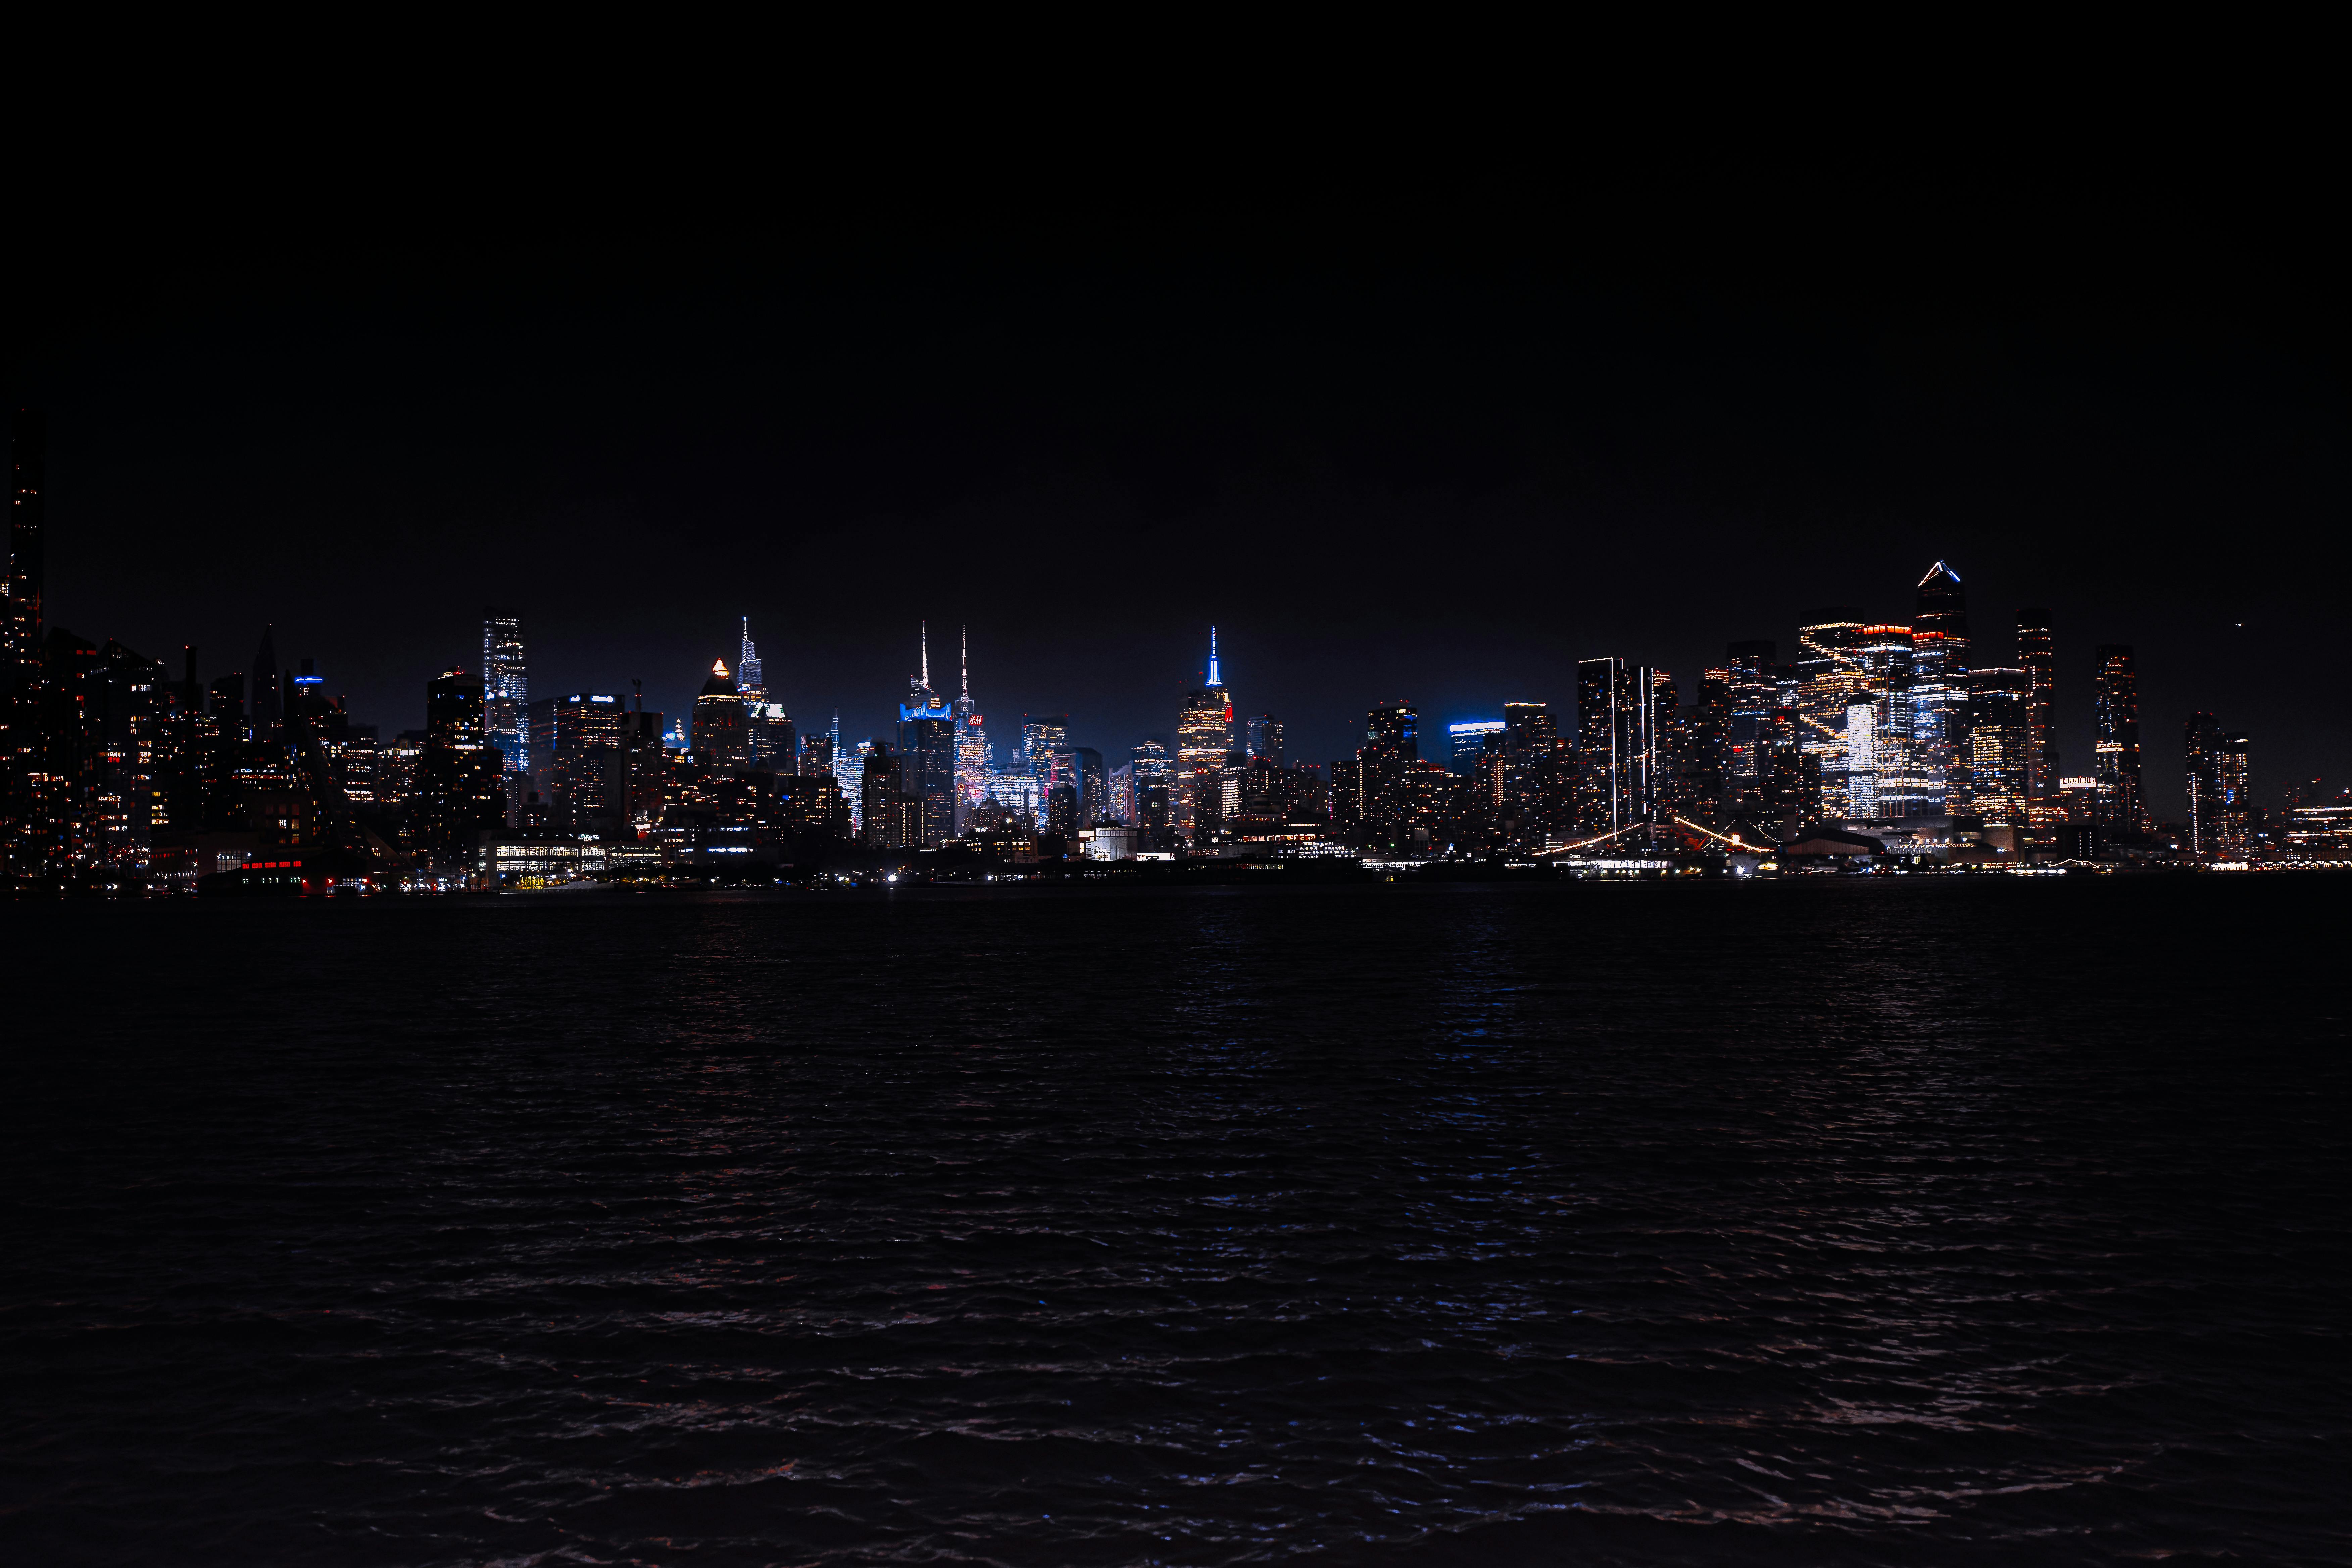 New York
Image by:Vladislav Lolenko
New York
Image by:Vladislav Lolenko
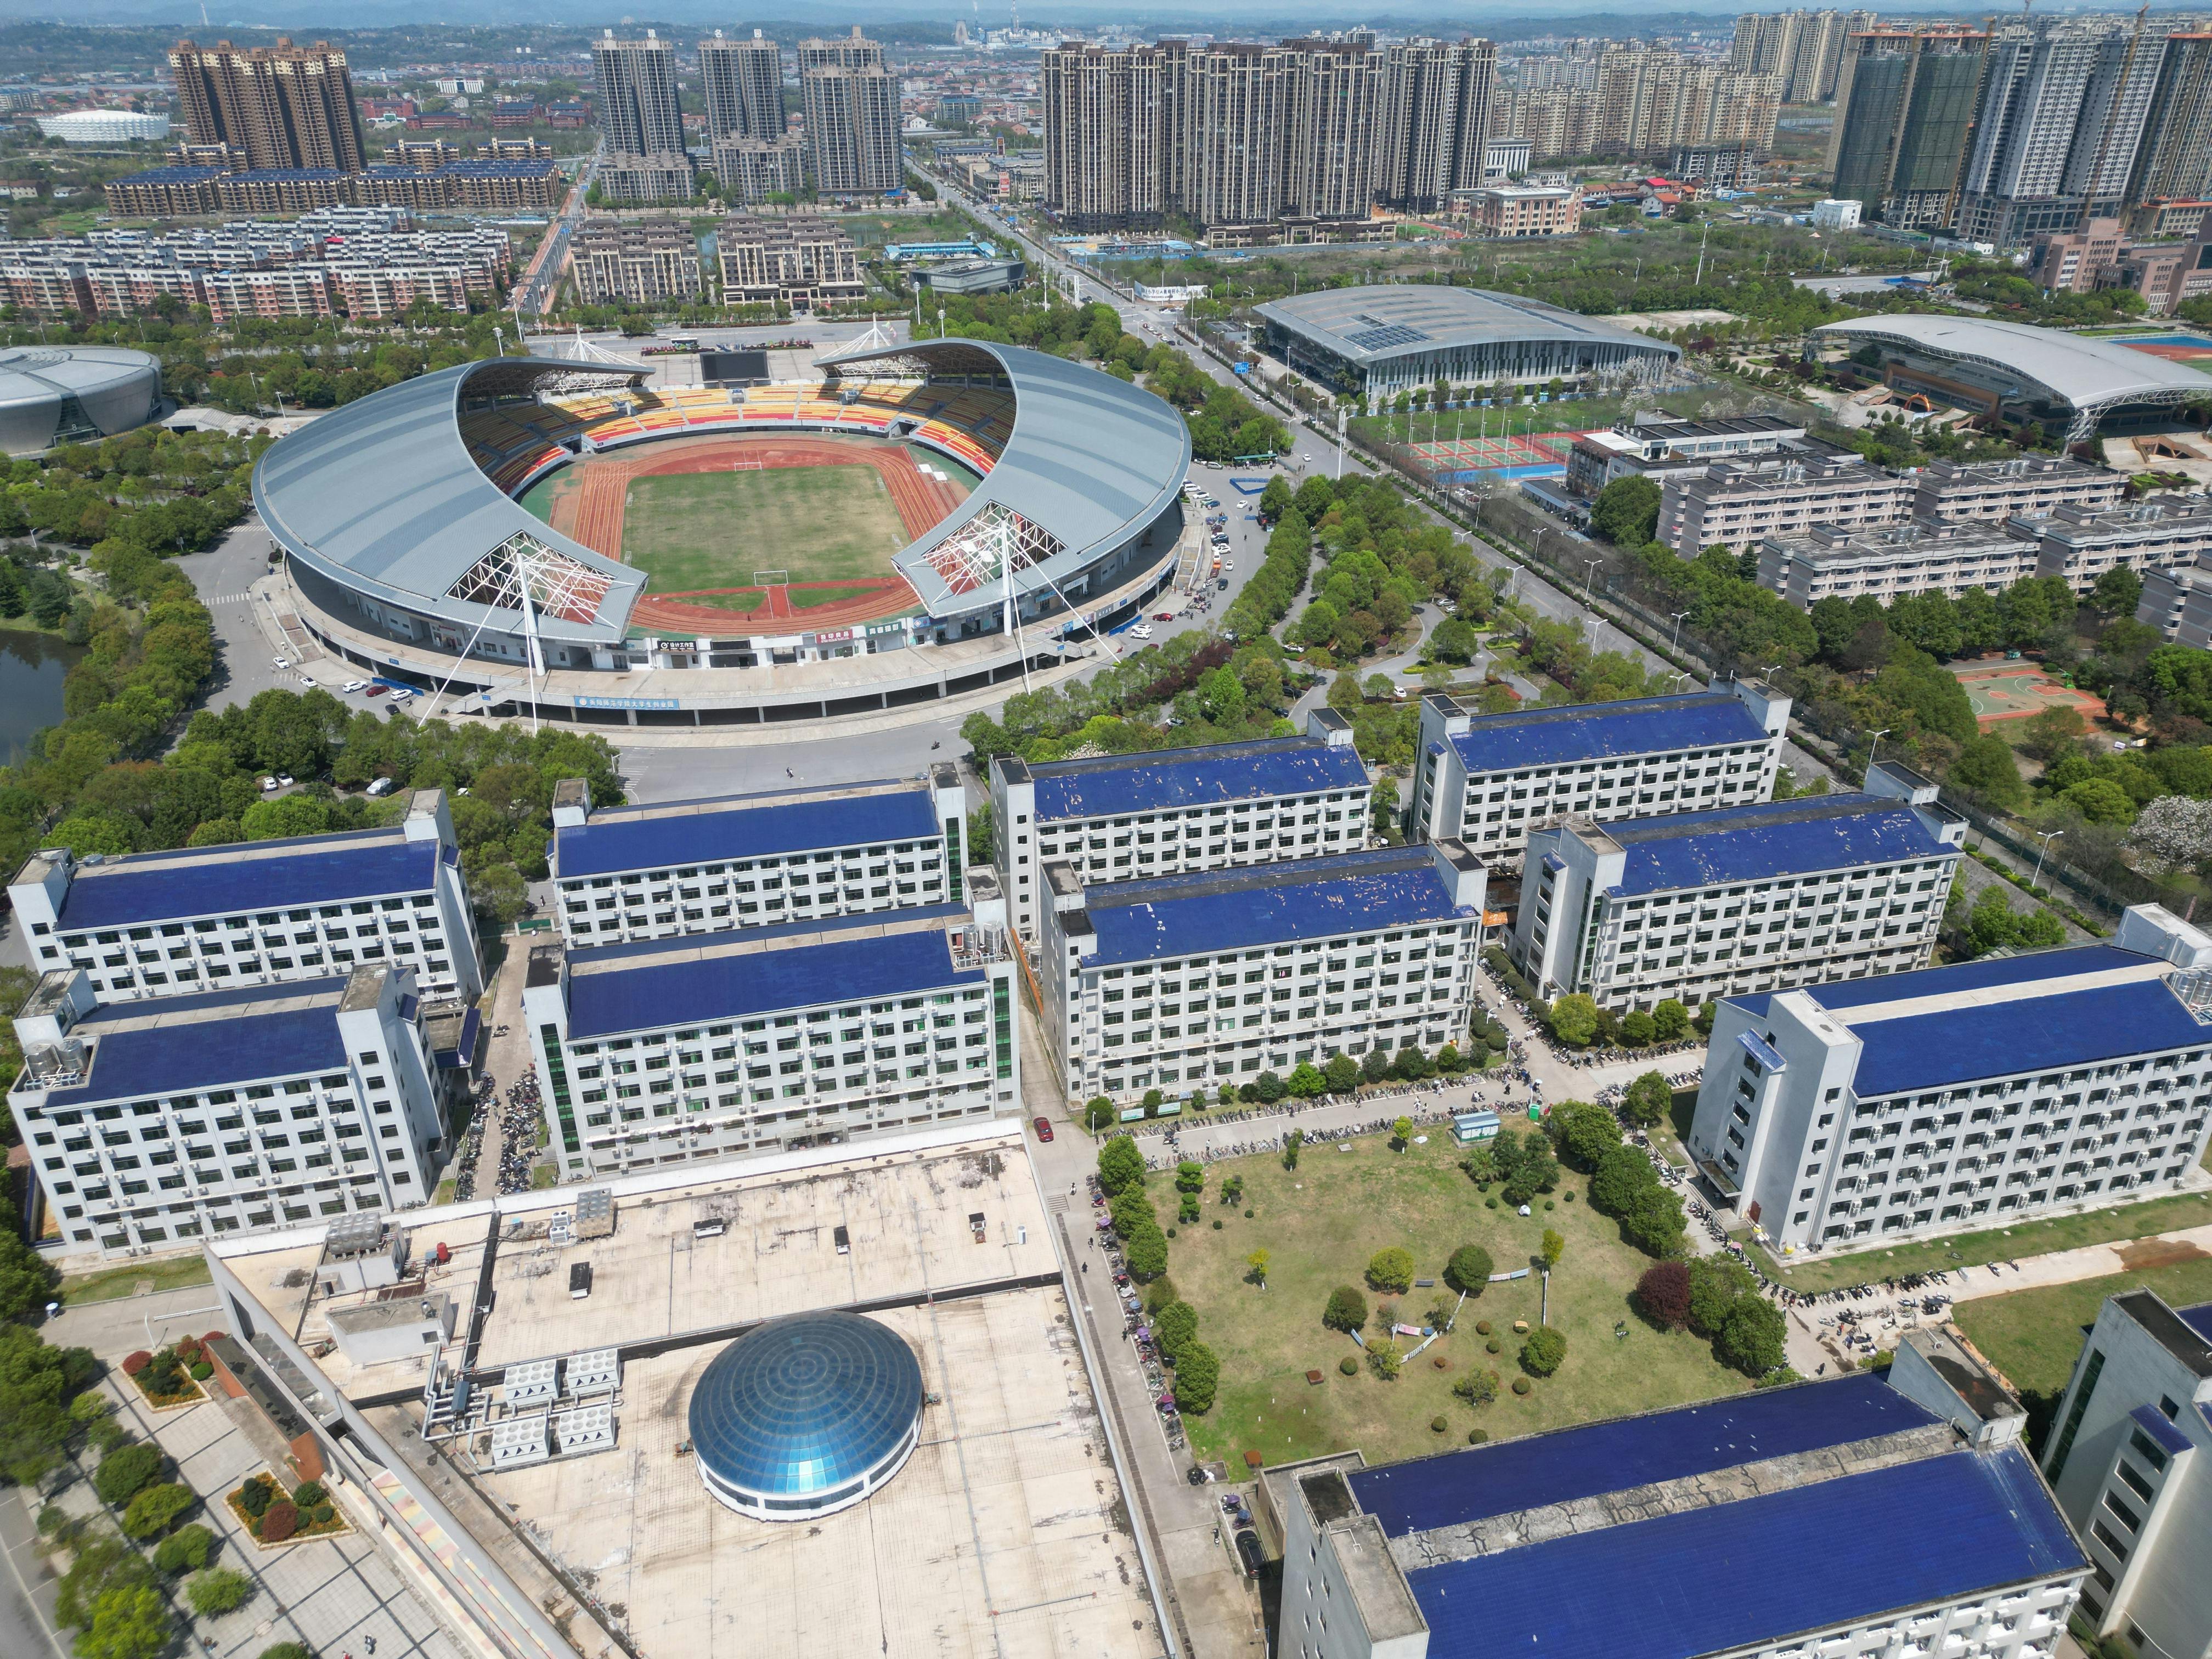 Hengyang
Image by:锋 欧阳
Hengyang
Image by:锋 欧阳
Overview
New York and Hengyang present fundamentally contrasting urban environments. New York, with a population exceeding six million, is a global financial and cultural hub characterized by extremely high costs of living and significant economic output. Hengyang, a major city in China with a substantially smaller population, represents a different scale and economic context. The comparison reveals vast differences in economic indicators, living expenses, and quality of life metrics, making direct comparisons challenging but revealing key differences in the lifestyle and financial landscape offered by each city.Economic Factors & Housing
New York demonstrates a significantly higher economic output, evidenced by its GDP per capita of $74,600 and a GDP growth rate of 2.89%. The city boasts a high net salary, though this is accompanied by correspondingly high living costs. The property market in New York is marked by high prices, reflected in the provided property price indices for specific areas, coupled with a relatively standard mortgage interest rate of 6.73%. In contrast, Hengyang shows a lower GDP per capita ($22,100) but a higher GDP growth rate (5.25%) and a lower mortgage rate (3.46%). While specific net salary data for Hengyang is not provided, its significantly lower property prices (as indicated by the property price indices) suggest a more affordable housing market compared to New York, despite the lower overall economic output per person.Quality of Life
The quality of life comparison highlights significant disparities. New York generally scores higher on international quality metrics, including GDP per capita and population growth rate. However, specific quality indices paint a different picture. New York's safety index is considerably higher (81) compared to Hengyang's (35). Healthcare access and quality are difficult to directly compare due to the lack of specific data for Hengyang, but New York's higher healthcare index (72) suggests better access or perceived quality. Climate comfort (New York: 67) and environmental cleanliness (New York: 58) are also rated higher in New York. Commuting is a major challenge in New York, with a very high average commute time (38 minutes), while Hengyang's commute time is not provided but likely lower. Pollution levels are a concern in New York, rated at 45, significantly higher than Hengyang's rating of 25.Investment & Career Prospects
Considering investment and career prospects, New York offers opportunities in a globalized economy with high salaries but also high costs and intense competition. Its GDP growth rate, while lower than Hengyang's, still reflects a developed economy. Hengyang presents a potentially attractive market for investment due to its higher GDP growth rate (5.25%) and lower cost of living. The lower property prices and potentially lower operational costs could offer better value for investment compared to the premium demanded in New York. Career prospects in Hengyang might be tied more directly to China's domestic economic growth story, whereas New York offers access to global markets and industries.Final Verdict
New York and Hengyang are vastly different cities offering distinct experiences and priorities. New York provides a high level of economic activity, global connectivity, and generally better scores on international quality-of-life indices (safety, healthcare, climate), but at a very high cost of living, particularly for housing and transportation. Hengyang offers a significantly lower cost of living, potentially attractive investment prospects given its growth rate, and a different cultural and economic context, though direct comparisons on quality metrics are limited. The choice between the two depends entirely on individual priorities regarding lifestyle, career goals, financial capacity, and tolerance for specific aspects like commute times and safety levels.Real estate & living comparison
| New York | Hengyang | |
|---|---|---|
| Rent Per Month » 3 Bedroom Apartment in City Centre | 9319.74 USD | 435.26 USD |
| Salaries And Financing » GDP Growth Rate: | 2.89 USD | 5.25 USD |
| Salaries And Financing » GDP Per Capita ($) : | 74600 USD | 22100 USD |
| Salaries And Financing » Population Growth Rate: | 0.67 USD | 0.23 USD |
| Childcare » International Primary School, Annual Tuition per Child | 59207.2 USD | 16322.33 USD |
| Childcare » Private Full-Day Preschool or Kindergarten, Monthly Fee per Child | 3360.85 USD | 330.8 USD |
| Clothing And Shoes » Jeans (Levi's 501 or Similar) | 68.7 USD | 88.1 USD |
| Clothing And Shoes » Men's Leather Business Shoes | 159.29 USD | 72.54 USD |
| Clothing And Shoes » Nike Running Shoes (Mid-Range) | 116.87 USD | 85.54 USD |
| Clothing And Shoes » Summer Dress in a Chain Store (e.g. Zara or H&M) | 53.25 USD | 32.09 USD |
| Markets » Apples (1 kg) | 7.19 USD | 2.83 USD |
| Markets » Bananas (1 kg) | 2.44 USD | 1.36 USD |
| Markets » Beef Round or Equivalent Back Leg Red Meat (1 kg) | 20.31 USD | 11.64 USD |
| Markets » Bottle of Wine (Mid-Range) | 18 USD | 12.19 USD |
| Markets » Bottled Water (1.5 Liter) | 2.56 USD | 0.41 USD |
| Markets » Chicken Fillets (1 kg) | 15.5 USD | 3.88 USD |
| Markets » Cigarettes (Pack of 20, Marlboro) | 19 USD | 2.9 USD |
| Markets » Domestic Beer (0.5 Liter Bottle) | 3.56 USD | 1.03 USD |
| Markets » Eggs (12, Large Size) | 6.8 USD | 1.7 USD |
| Markets » Fresh White Bread (500 g Loaf) | 4.62 USD | 2.32 USD |
| Markets » Imported Beer (0.33 Liter Bottle) | 4.28 USD | 1.54 USD |
| Markets » Lettuce (1 Head) | 2.93 USD | 0.61 USD |
| Markets » Local Cheese (1 kg) | 17.87 USD | 12.62 USD |
| Markets » Milk (Regular, 1 Liter) | 1.31 USD | 1.96 USD |
| Markets » Onions (1 kg) | 3.24 USD | 1.57 USD |
| Markets » Oranges (1 kg) | 5.63 USD | 1.83 USD |
| Markets » Potatoes (1 kg) | 3.31 USD | 0.96 USD |
| Markets » Tomatoes (1 kg) | 6.13 USD | 1.92 USD |
| Markets » White Rice (1 kg) | 7.64 USD | 0.97 USD |
| Rent Per Month » 3 Bedroom Apartment in City Centre | 9319.74 USD | 435.26 USD |
| Restaurants » Bottled Water (0.33 Liter) | 2.6 USD | 0.17 USD |
| Restaurants » Cappuccino (Regular Size) | 5.64 USD | 3.48 USD |
| Restaurants » Combo Meal at McDonald's (or Equivalent Fast-Food Meal) | 14 USD | 4.79 USD |
| Restaurants » Domestic Draft Beer (0.5 Liter) | 8 USD | 1.23 USD |
| Restaurants » Imported Beer (0.33 Liter Bottle) | 10 USD | 1.88 USD |
| Restaurants » Meal at an Inexpensive Restaurant | 25 USD | 2.9 USD |
| Restaurants » Meal for Two at a Mid-Range Restaurant (Three Courses, Without Drinks) | 140 USD | 25.39 USD |
| Restaurants » Soft Drink (Coca-Cola or Pepsi, 0.33 Liter Bottle) | 2.94 USD | 0.35 USD |
| Salaries And Financing » Annual Mortgage Interest Rate (20-Year Fixed, in %) | 6.73 USD | 3.46 USD |
| Sports And Leisure » Cinema Ticket (International Release) | 21 USD | 4.21 USD |
| Transportation » Gasoline (1 Liter) | 0.88 USD | 1.12 USD |
| Transportation » Taxi 1 Hour Waiting (Standard Tariff) | 42 USD | 6.53 USD |
| Transportation » Taxi 1 km (Standard Tariff) | 2.17 USD | 0.29 USD |
| Transportation » Taxi Start (Standard Tariff) | 3 USD | 1.31 USD |
| Transportation » Toyota Corolla Sedan 1.6 (or Equivalent New Mid-Size Car) | 25824.12 USD | 17091.29 USD |
| Transportation » Volkswagen Golf 1.5 (or Equivalent New Compact Car) | 35458 USD | 18846.85 USD |
| Utilities (Monthly) » Basic Utilities for 85 m2 Apartment (Electricity, Heating, Cooling, Water, Garbage) | 200.17 USD | 45.31 USD |
| Utilities (Monthly) » Broadband Internet (Unlimited Data, 60 Mbps or Higher) | 68.44 USD | 14.51 USD |
| Utilities (Monthly) » Mobile Phone Plan (Monthly, with Calls and 10GB+ Data) | 65.91 USD | 12.91 USD |
| Population | 18,832,416 | 6,645,243 |
Last updated: 2026-03-09
Comments for this comparison