Delhi vs. Xinyang: Detailed 2026 Cost of Living & Quality Comparison
 Delhi
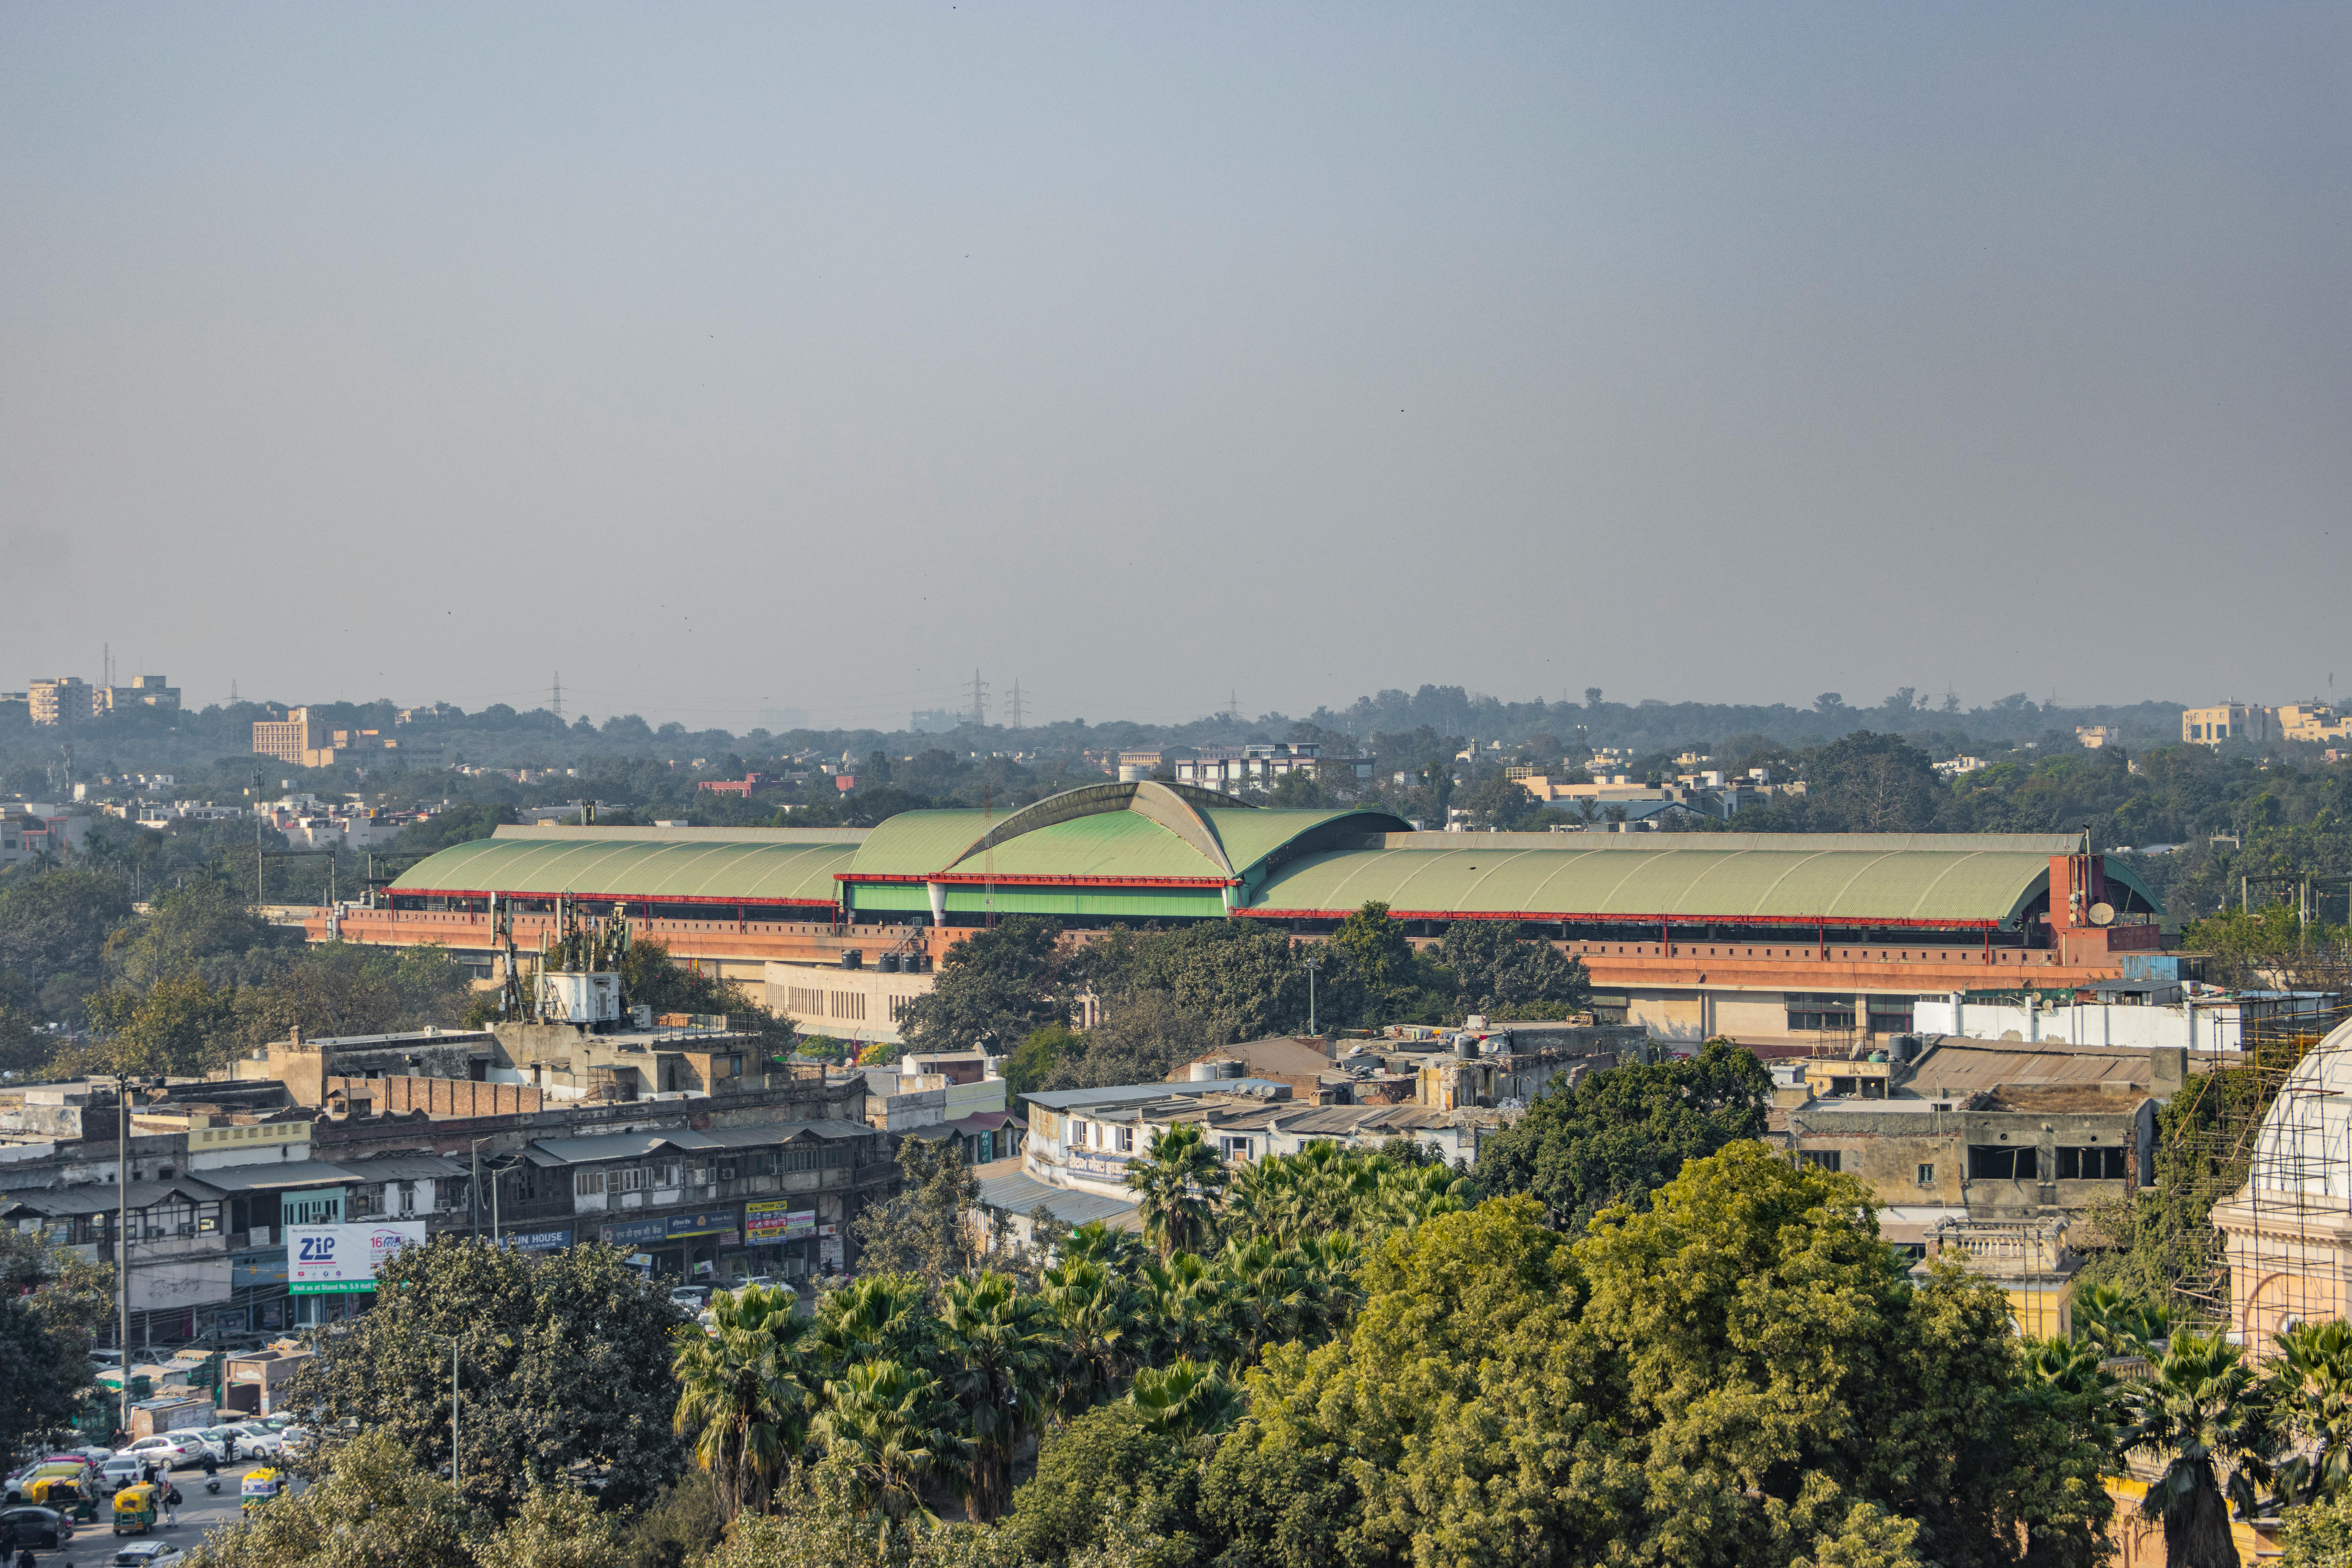
Image by:Shantum Singh
Delhi
Image by:Shantum Singh
Overview
Delhi, the capital territory of India, stands as a sprawling metropolis with a population exceeding 32 million, representing one of the world's most significant urban centers. It is characterized by immense economic dynamism, a rich cultural heritage, and rapid development, though it also faces substantial challenges related to its sheer scale. In stark contrast, Xinyang is a major city located in the Henan province of China, with a considerably smaller population of approximately 6.1 million. While Xinyang is an important regional hub in central China, it operates on a different scale and economic trajectory compared to the global influence of Delhi. Both cities present unique opportunities and challenges for residents and businesses, differing significantly in their economic structures, cost structures, and overall quality of life metrics, making a direct comparison essential for understanding their distinct profiles.Economic/Housing Comparison
Delhi demonstrates a vibrant, albeit rapidly growing, economy with a GDP per capita of $9,200 and an 8.15% GDP growth rate, reflecting its position as a major Indian economic engine. The city offers diverse job opportunities across services, manufacturing, and emerging sectors, though salaries, even the net average monthly income after tax, may not reach the levels seen in higher-growth Chinese cities. Housing affordability in Delhi presents a significant hurdle, with average net salaries being considerably lower than the property prices required to purchase even an apartment outside the city center. The average monthly net salary in Delhi is $546.96, while the cost of living indices for specific areas like Chandausi are alarmingly high at 192.35. Conversely, Xinyang exhibits a higher GDP per capita of $22,100 and a more modest GDP growth rate of 5.25%, suggesting a potentially more affluent population base despite slower growth. Crucially, Xinyang offers significantly lower property prices, with a much lower annual mortgage interest rate of 3.49%, making homeownership more accessible than in Delhi, where the interest rate is 9.57%. The stark difference in property affordability, driven by salary levels and interest rates, is a defining factor in the economic landscape of these two cities.Quality of Life Comparison
The quality of life in Delhi and Xinyang presents a complex picture based on available data. Delhi generally shows higher purchasing power for daily consumables, with mid-range restaurant meals for two costing around $7.96 USD compared to $7.92 USD in Xinyang. However, Delhi faces significant environmental and safety challenges, reflected in its lower safety perception and higher pollution levels, which negatively impact quality of life metrics not explicitly detailed but inferred from the city's profile. Healthcare access might be variable, but the data does not provide direct comparisons. Xinyang, while showing slightly higher costs for certain basic groceries like milk ($1.77 USD vs. $0.40 USD in Delhi), has a higher cost for childcare ($362.72 USD annually vs. $1,000 USD in Delhi), potentially offsetting some other savings. The city's data does not provide specific quality indices like safety or pollution, leaving a gap in the direct comparison, but its overall economic profile suggests a different set of trade-offs compared to the megacity environment of Delhi.Investment/Career Prospects
From an investment and career perspective, both cities offer distinct opportunities. Delhi, as part of India's financial capital, provides access to a vast and rapidly expanding domestic market, offering immense potential for businesses targeting South Asia. The city's dynamic environment fosters innovation and diverse career paths, though intense competition exists. Xinyang, benefiting from China's massive economy and established industrial base, offers stability and access to a large consumer market. Its higher GDP per capita and lower cost of living (particularly for essentials and property) could present more favorable investment returns for certain types of businesses or individuals seeking a higher standard of living at a lower cost. The differing economic growth rates (8.15% vs. 5.25%) and population growth trajectories (0.72% vs. 0.23%) further suggest different long-term investment profiles, with Delhi potentially offering higher growth potential but also facing greater internal pressures.Final Verdict
In conclusion, Delhi and Xinyang represent two vastly different urban environments with distinct economic characteristics, cost structures, and quality of life factors. Delhi, as a major Indian metropolis, offers immense economic dynamism and career opportunities but comes with significantly higher costs for living, particularly for housing and property, and faces substantial challenges related to safety and environmental quality. Xinyang, while smaller than Delhi, presents a more affordable cost of living, especially concerning property, and benefits from China's economic strength, though its growth rate is more modest. The choice between these two cities hinges critically on individual priorities: those prioritizing career growth within a massive, fast-developing market and potentially higher costs may lean towards Delhi, while those seeking a potentially more affordable lifestyle within a stable, large-market economy might find Xinyang more appealing, despite the trade-offs in lower growth rates and potentially less intense economic activity. The data underscores the importance of aligning personal financial capacity and career goals with the specific economic and cost realities of each location.Real estate & living comparison
| Delhi | Xinyang | |
|---|---|---|
| Salaries And Financing » GDP Growth Rate: | 8.15 USD | 5.25 USD |
| Salaries And Financing » GDP Per Capita ($) : | 9200 USD | 22100 USD |
| Salaries And Financing » Population Growth Rate: | 0.72 USD | 0.23 USD |
| Childcare » International Primary School, Annual Tuition per Child | 1890.45 USD | 11002.46 USD |
| Childcare » Private Full-Day Preschool or Kindergarten, Monthly Fee per Child | 67.05 USD | 362.72 USD |
| Clothing And Shoes » Jeans (Levi's 501 or Similar) | 26.11 USD | 51.51 USD |
| Clothing And Shoes » Men's Leather Business Shoes | 49.17 USD | 83.43 USD |
| Clothing And Shoes » Nike Running Shoes (Mid-Range) | 58.15 USD | 79.8 USD |
| Clothing And Shoes » Summer Dress in a Chain Store (e.g. Zara or H&M) | 30.22 USD | 30.83 USD |
| Markets » Apples (1 kg) | 1.9 USD | 1.91 USD |
| Markets » Bananas (1 kg) | 0.78 USD | 1.1 USD |
| Markets » Bottle of Wine (Mid-Range) | 10.34 USD | 11.17 USD |
| Markets » Bottled Water (1.5 Liter) | 0.32 USD | 0.6 USD |
| Markets » Chicken Fillets (1 kg) | 3.6 USD | 3.48 USD |
| Markets » Cigarettes (Pack of 20, Marlboro) | 3.81 USD | 2.9 USD |
| Markets » Domestic Beer (0.5 Liter Bottle) | 1.86 USD | 0.72 USD |
| Markets » Eggs (12, Large Size) | 1.18 USD | 1.53 USD |
| Markets » Fresh White Bread (500 g Loaf) | 0.56 USD | 1.6 USD |
| Markets » Imported Beer (0.33 Liter Bottle) | 2.7 USD | 1.77 USD |
| Markets » Lettuce (1 Head) | 0.53 USD | 0.36 USD |
| Markets » Local Cheese (1 kg) | 4.57 USD | 11.97 USD |
| Markets » Milk (Regular, 1 Liter) | 0.72 USD | 1.77 USD |
| Markets » Onions (1 kg) | 0.44 USD | 0.8 USD |
| Markets » Oranges (1 kg) | 1.09 USD | 1.39 USD |
| Markets » Potatoes (1 kg) | 0.36 USD | 0.73 USD |
| Markets » Tomatoes (1 kg) | 0.59 USD | 1.03 USD |
| Markets » White Rice (1 kg) | 0.83 USD | 0.97 USD |
| Restaurants » Bottled Water (0.33 Liter) | 0.17 USD | 0.28 USD |
| Restaurants » Cappuccino (Regular Size) | 2.34 USD | 2.29 USD |
| Restaurants » Combo Meal at McDonald's (or Equivalent Fast-Food Meal) | 3.81 USD | 4.13 USD |
| Restaurants » Domestic Draft Beer (0.5 Liter) | 2.56 USD | 0.58 USD |
| Restaurants » Imported Beer (0.33 Liter Bottle) | 3.26 USD | 1.45 USD |
| Restaurants » Meal at an Inexpensive Restaurant | 5.44 USD | 2.9 USD |
| Restaurants » Meal for Two at a Mid-Range Restaurant (Three Courses, Without Drinks) | 21.76 USD | 15.96 USD |
| Restaurants » Soft Drink (Coca-Cola or Pepsi, 0.33 Liter Bottle) | 0.45 USD | 0.43 USD |
| Salaries And Financing » Annual Mortgage Interest Rate (20-Year Fixed, in %) | 9.57 USD | 3.49 USD |
| Sports And Leisure » Cinema Ticket (International Release) | 5.44 USD | 5.95 USD |
| Transportation » Gasoline (1 Liter) | 1.08 USD | 1.16 USD |
| Transportation » Taxi 1 Hour Waiting (Standard Tariff) | 1.14 USD | 4.35 USD |
| Transportation » Taxi 1 km (Standard Tariff) | 0.27 USD | 0.29 USD |
| Transportation » Taxi Start (Standard Tariff) | 0.92 USD | 1.45 USD |
| Transportation » Toyota Corolla Sedan 1.6 (or Equivalent New Mid-Size Car) | 22784.73 USD | 15971.21 USD |
| Transportation » Volkswagen Golf 1.5 (or Equivalent New Compact Car) | 14143.19 USD | 18846.85 USD |
| Utilities (Monthly) » Basic Utilities for 85 m2 Apartment (Electricity, Heating, Cooling, Water, Garbage) | 53.38 USD | 68.88 USD |
| Utilities (Monthly) » Broadband Internet (Unlimited Data, 60 Mbps or Higher) | 8.33 USD | 10.59 USD |
| Utilities (Monthly) » Mobile Phone Plan (Monthly, with Calls and 10GB+ Data) | 4.46 USD | 7.24 USD |
| Population | 32,226,000 | 6,109,106 |
Last updated: 2026-03-06
Comments for this comparison